The following is the next installment in a series on writing for publication from Kris Greiner, editor in the Design Center. Explore her suite of editing services.
As the saying goes, “a picture is worth a thousand words.” This is especially relevant to manuscripts or any type of visual presentation (such as posters or PowerPoint presentations), when word count or space is limited.
Figures, tables, and graphs are often the best way to quickly and easily present a lot of data or a complex idea. Readers and audiences are drawn to these elements simply because they are easily and quickly understood.
When including these elements in a manuscript, always check the target journal’s instructions. You will likely be limited in the number of tables and images allowed, including supplemental or online-only material. Journals will also have very specific instructions for formatting images and tables.
Next, decide which data or concepts are best presented in tables and figures. Obviously, large sets of variables, numerical results, and p-values are best presented in tabular format than in the text, but complex processes can also be presented in an image, whether borrowed (with permission!), or newly created.
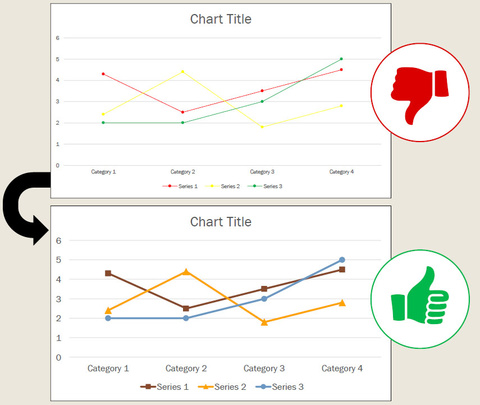
Whatever format your data takes, use caution in creating anything that’s heavily embellished. Keep tables simple — don’t use too much color, if any, and use a sans-serif font and simple borders. The same rules apply to graphs or charts. There are a lot of features available in various software programs that create graphs and charts, such as 3D bars, bright color schemes, or font enhancements. Using too many of these features will only take away from the data presented.
Finally, check to be sure that whatever you include with your paper will be published or printed as you have intended. For example, some journals will present images and table in color on their online versions, but black and white in print, usually to save costs. Thus, make sure your colorful image will translate well to black and white, and that details are not lost.
I’m always happy to help authors and presenters with create or format images and tables, as well as secure permission to reuse previously published works. Our Design Center graphics experts are also available to create an original, effective figure.
Please feel free to contact me for any assistance at kristina-greiner@uiowa.edu.